Nifty 50 charts technical analysis - august 2019
Nifty 50 charts technical analysis - 1 Candlestick pattern
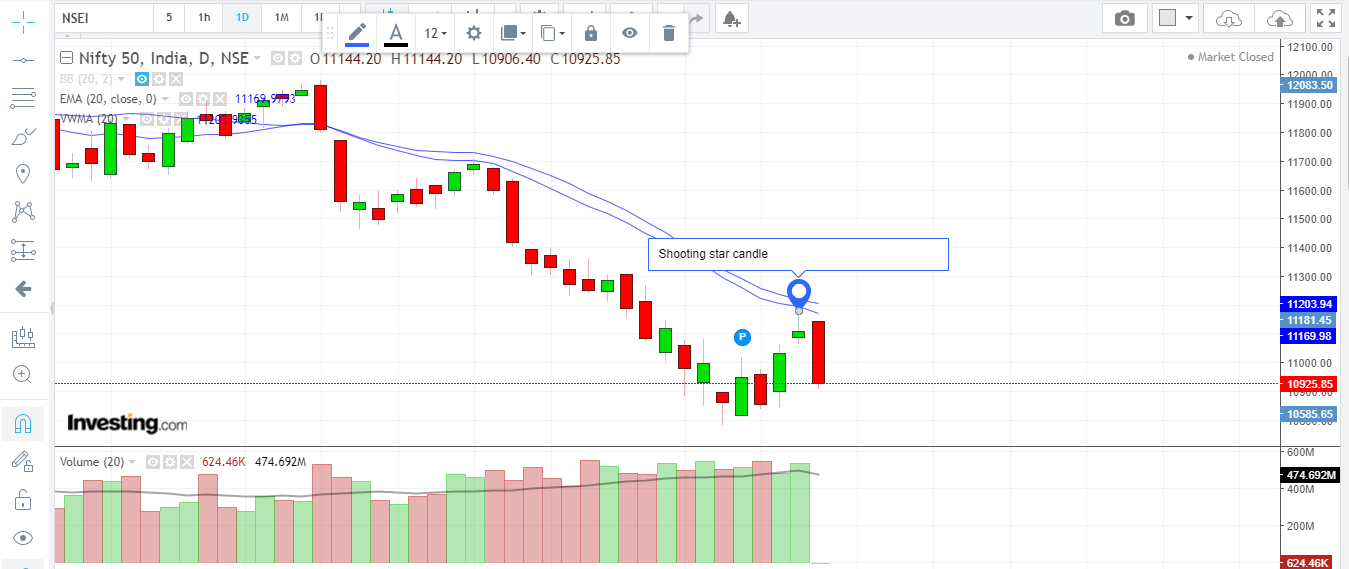
- Shooting star candlestick pattern is bearish when it forms after upmove
- The shooting star chandlestick patterns implies that buyers try to push the price to day high but sellers drag down the price to the opening levels at the end of day
- If price break the low of shooting star - Downtrend continue till the previous low
Nifty 50 charts technical analysis - 2 Fibonacci Retracement levels

- As per Fibonacci Retracement nifty close above 10921 level
- If Nifty close or trade below 10921 level it will touch 10604
Nifty 50 charts technical analysis - 3 Support and resistance levels

- Check the slop of 20 day exponential moving average
- Check the slop of VWMA
- The slop anlge is lesser than 45 dergee menas the downtrend is very strong
- Any reversal happens after the price close ablve the 20 EMA and VWAP
Nifty 50 charts technical analysis - 4 Option chain analysis

- As per option chain analysis Maxium open intrest on call side is at 11000 call which will as a resistance
- Maxmium open intrest at put side is at 10600 which will act as a support
- Change in openintrest is maxmium at 11000 call and 10600 put with low volumes
- If the change in open intrest happen with low vloume implies that some big players are entered at thet level
- FII are buying the put and DII are selling call options for this month
- Retail investors are bullish on market and buying call and selling puts due to the FPI news but the news effect will remain for very short term there are big problems in the ecomony ant if will take some time to revive.

- Conclusion : Nifty will reach the level of 10600 first and start it uptrend
Note : This analysis is for educational puropse only.


0 Comments
Thank you for your valuable comment