Double top pattern cheat sheet
In this blog, you will learn how to trade double top patterns specifically you will learn what mistake trader makes while trading double top chart pattern. How to short the high with low risk. What is the best time to trade the breakdown? A secret technique that increase the probability of your trade.
Our Automated excel sheet for nifty options
Advance nifty option trading automated excel sheet with back Testing
Mistake trader makes -
- Traders think that stock uptrend will reverse after just because they find a double top pattern
- Strength of the trend and the duration of a trend are the two parameters
- OBV indicator is a good tool to track the strength of the trend
- E.g. If the stock is in an uptrend for 1 year and double top developed in 3 weeks
- What is odd here? The 3 weeks pattern cannot overcome the 1-year pattern so chances are this pattern will fail.
- A trader should aware of these parameters
How to short the high of the double top
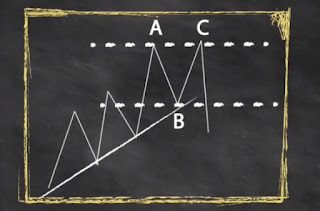
- Refer to the picture above
- The market in an uptrend Don't short when the stock price reaches point C
- If the stock moves up from point C it will create a huge loss because we don't have a stop-loss point.
- If stock price move up and close below point C it is a perfect setup
- Because the high is now the stop loss point for this trade and point B is the target
Best time to short the double top breakdown
- Wait for the stock price to consolidate near neckline as shown in picture
- When Stock price breaks the neckline place the stop loss at the top of consolidation level
- This setup will give a good risk to reward trade
Tips to trade double top
- Don't blindly Trade double top check the previous trend strength
- You can short the double top at the high using reversal candlestick pattern like shooting star, Doji.
- Find consolidation near the neckline and when the neckline breakdown takes your trade and place your stop loss at the top of consolidation.


0 Comments
Thank you for your valuable comment