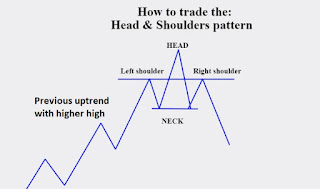
Head and shoulders pattern cheat sheet
In this blog, you will learn how to trade head and shoulders patterns. We will learn what is head and shoulder patters and how it works., the biggest mistake trader makes when the trading head and shoulders patterns and three to head and shoulder pattern technique to trade consistently and profitably.
Let's Begin
What is the head and shoulders pattern?
Our Automated excel sheet for nifty options
Advance nifty option trading automated excel sheet with back Testing
- Head and shoulder pattern is a trend reversal pattern looks like the above mention picture
- It has three components Left shoulder - head - right shoulder
- The horizontal neckline is the main area to focus it connect all three components.
- When market break below the neckline it signals that the previous uptrend is reversed
- You need to train your eyes to see these patterns on the chart
- Stock with the uptrend making higher highs and suddenly after hitting the new high called head it reversed to a previous high low of left shoulders and not able to cross left shoulder high and start trade below the neckline.
Mistake traders maker
- Traders think that stock uptrend will reverse after just because they find head and shoulder pattern
- Strength of the trend and the duration of a trend are the two parameters
- OBV indicator is a good tool to track the strength of the trend
- E.g. If the stock is in an uptrend for 1 year and head and shoulders pattern developed in 3 weeks
- What is odd here? The 3 weeks pattern cannot overcome the 1-year pattern so chances are this pattern will fail.
- A trader should aware of these parameters
How Not to trade head and shoulders pattern?
- When stock break the neckline trader jumps into the trade and they put the stop loss at the head of the pattern.
- Because the pattern will be invalidated if the price breaks above the head level.
- The problem with this setup is stop loss is very large
- The risk to reward ration in this setup is not good.
How to trade head and shoulders pattern?
Wait for consolidation
- Wait for the stock to consolidate in the right shoulder area
- When Stock price breaks the neckline place the stop loss at the top of consolidation level
- This setup will give good risk to reward trade
The First Pullback
- When stock price breaks the neckline and stock price fall 3 percent then it retraces or pull back 1 % and forms small candles with low volumes
- When stock price starts to fall again with volume and break the 3% level short the stock with stock loss at the high if 1% pullback
The retest level
- When Stock price breaks the neckline level it retests the neckline level.
- When the stock price is near the neckline it will act as a resistance
- This level is good for placing a short trade with the stop loss of right shoulders high
Learn more about why trend line works and other articles


1 Comments
Hi, Your post is very informative, Here we offer same services like head and shoulders pattern where
ReplyDeletetrade price charts and market statistics.form of investment valuation that analyzes past prices to predict future price action.
Thank you for your valuable comment